


MPF Part 1: What it Costs You
11 February 2007
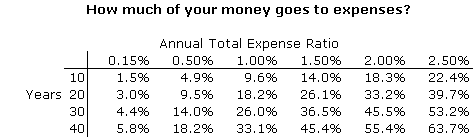
In a previous article (Scrap the MPF, 23-Jun-05) Webb-site.com drew attention to the fact that a Mandatory Provident Fund index-tracking fund cost employees 2% per year on their accumulated contributions, equivalent to a 55% value-reduction over 40 years, or 33% over 20 years, relative to the underlying investment performance. Here's that table again:
As you are about to discover, most MPF funds weigh in at well over 2% annual expenses.
Misleading performance
Partly in response to our criticisms, the MPF Authority came out last year with a 5-year investment performance review, seeking to draw attention to investment returns and away from analysing expenses. The report claimed that the MPF system as a whole recorded "an annualized return of 6.99% over the five-year period after fees and charges". In our view, that claim was misleading, and we'll show you why. Page 6 of the report gives 5 yearly returns for the scheme:
| Year to 31-Mar | Return |
|---|---|
| 2002 | -2.49% |
| 2003 | -11.21% |
| 2004 | 20.08% |
| 2005 | 4.56% |
| 2006 | 11.70% |
The next line of the table makes that claim of 6.99% again, but if you compound the 5-year returns together, you in fact get a total of 21.42% over 5 years, which is a compound average return (CAR) of 3.96% per year. The figure used in the report was (as the small print discloses) an internal rate of return (IRR) or "dollar-weighted" figure which was higher because there was more money in the scheme in the later, positive years, than there was in the earlier, negative years of the scheme. You can't depend on that pattern repeating itself, but even if exactly the same sequence of annual returns occurred, for those in the scheme from the beginning, the weight of the money already invested would drag the IRR back towards the compound average. The CAR is the fair measure to use.
In any event, 5 years is not a long time in market terms. We have no reason to believe that the gross average performance of all funds will be any worse or better than the underlying markets as a whole, but the net performance is what matters, and what the report completely avoids mentioning is the annual impact of fees and expenses, and how much lower that impact would be if people were allowed to invest their own money directly in the markets or in index funds.
Expenses running at 2.5% per year
In Jun-04, the MPFA published the Code on Disclosure for MPF Investment Funds, but most of its requirements did not kick in until recently. Fund expense ratios (FERs) were calculated for any financial year which commences after 31-Dec-04. Some fund providers, such as HSBC, use a June year-end, so the first figures, for the year to Jun-06, have only recently appeared. The Code requires an "On-going Cost Illustration" in a prescribed format which shows the FER for the latest year, and the dollar cost of such expenses after 5 years for each $1,000 invested, assuming a gross return of 5% per year.
Some, but not all, trustees publish these figures on their web sites. The table below shows, for each trustee (in alphabetic order), the lowest and highest FERs of the funds in their disclosure, and the projected 5-year cost for each $1,000 invested:
| Trustee | Min FER % | Max FER % | 5-year cost on $1000 | |
|---|---|---|---|---|
| Min $ | Max $ | |||
| Bank Consortium Trust | 1.79 | 2.04 | 100 | 114 |
| BOCI-Prudential | 1.61 | 1.75 | 90 | 98 |
| Fidelity | 2.24 | 2.53 | 123 | 139 |
| HSBC/Hang Seng Bank | 2.00 | 2.81 | 111 | 154 |
| ING Pension Trust | 2.05 | 2.81 | 114 | 154 |
| Manulife | 2.32 | 2.33 | 128 | 129 |
| Principal Class A | 2.23 | 2.28 | 123 | 126 |
| Sun Life | 2.07 | 2.11 | 115 | 117 |
Note: BCT maximum FER is adjusted for refund of a maintenance fee
Under the Code, those expense ratios are actually understated, because they exclude transaction costs on the underlying investments, such as stamp duty and brokerage costs on buying or selling equities. If these aren't expenses, then what are they? The more actively a fund turns over its portfolio, the higher those costs will be, eating into the returns on the funds relative to the markets in which they invest. You can probably add another 0.2% to those FERs to take account of underlying transaction costs, so you'll be looking at a mid-point of about 2.5% per year, which after 5 years will cost you about $138 for every $1,000 invested.
That's just 5 years! If the MPF continues, over a lifetime of contributions, the performance of all funds will be crushed by the expenses.
The lack of competition on MPF fees should be no surprise, because it is the employers who choose the fund providers, not the employees, and the only way to change providers is to change jobs, in which case you can move the money to a fund provider of your choice, or to your new employer's fund provider, but in the process you may incur redemption charges.
To stimulate competition, the MPFA should publish on its web site the expense ratios and complete historic performance figures of every fund in the MPF schemes, in an easily searchable database with comparison tables by fund type, so that the public can more readily find out which are the highest-cost and lowest-cost providers for each type of fund. At the moment, you can hunt all over the internet and still not find that information. All the MPFA has produced is clumsy Excel spreadsheets of unit prices, one for each of the last 12 months, but no performance or expense data. The MPF, as long as it exists, is always going to be expensive to administer, and those costs are going to be built into the funds, but competition would help limit the damage to employee's wealth.
Incidentally, the transparency in the mutual fund industry (outside of the MPF) is even worse, as the SFC's Code on Unit Trusts and Mutual Funds contains no disclosure requirement on expense ratios in mutual fund advertisements reports or fact sheets. We call on the SFC to address this problem, and then to publish on its web site a database of mutual fund returns and expense ratios. Indeed it would be better if the SFC and MPF worked together on this so that people can compare MPF funds with non-MPF funds.
Past investment performance may not be a guide to the future, but past expense ratios are.
© Webb-site.com, 2007
Organisations in this story
Sign up for our free newsletter
Recommend Webb-site to a friend
Copyright & disclaimer, Privacy policy